22/tcp open ssh_visual80/tcp open web_shell443/tcp open privacy_tls404/tcp closed tracking
4 sectors scanned // 0 threats
NEURAL LINK OVERLOADBUFFER_SPIKE // 0xFF77A9
DISPLAY SIGNAL LOST[ ESC / TAP ]
⚠ SYSTEM PANIC ⚠QUANETRA_FAILSAFE_PROTOCOL // SYSTEM HALTED[ ESC / TAP ]
NORMAL~/quanetra/homestatsutf-8en
[ ROUTE://SYNC ]
jakub@quanetra:~/projects$ ssh pi@homestats
Raspberry Pi · Matter · SQLite
Your home measures itself. And keeps the answer at home.
A collector polls your Matter sensors every minute and appends the readings to SQLite on the Raspberry Pi. The same computer serves ten views over your home network: from “what is happening now”, through traces, rhythms and relationships, to energy cost, events, a report and raw rows. No cloud, account or subscription.
A coloured text illustration: four measurement traces from the living room, an airing entry below them, and a cloud-request counter reading zero.
poll --every 1min
[00]----[01]----[02]----[03]----[04]----[00]----[01]----[02]----[03]----[04]----[00]----[01]----[02]----[03]----[04]----[00]----[01]----[02]----[03]----[04]----+-------+.......+-------+.......+-------++-------+.......+-------+.......+-------++-------+.......+-------+.......+-------++-------+.......+-------+.......+-------+{ scan }-->{ sort }-->{ tag }-->{ find }{ scan }-->{ sort }-->{ tag }-->{ find }{ scan }-->{ sort }-->{ tag }-->{ find }{ scan }-->{ sort }-->{ tag }-->{ find }
[ FEATURES://INDEX ]items = 6;
// features
One database, one Pi, ten questions for the house.
+--[01]--+
A reading every minute
The collector asks every Matter sensor once a minute and stores the reading with its device name, endpoint and unit. Names live in a table of their own, so renaming a sensor covers the whole history — it never splits into two lines on a chart.
+--[02]--+
Derived from what is there
Temperature and humidity give dew point, absolute humidity and apparent temperature — no new sensor, and for the whole history backwards. Socket power gives consumption, cost at your tariff, standby draw and the appliance’s duty cycle.
+--[03]--+
A window you choose
6 h, 24 h, 7 days, 30 days, or any interval. One control bar drives every data view: comparison with the previous period, a profile from the preceding seven days, aggregation and CSV export.
+--[04]--+
43 panels, not one wall
The interface is divided by question: Now, Traces, House, Rhythm, Comparisons, Energy, Events and Report. Every panel has a number and a place in the side rail, while the digest beneath the filters gives the key findings for the current page.
+--[05]--+
Staleness is visible
When the oldest sensor has been silent longer than the threshold set in Configuration, a red banner comes up over a dimmed page: it stops pretending to show the present. The same banner, in amber, reports a failed fetch.
+--[06]--+
The building’s time constant
Overnight cooling yields one number: how well the house holds heat. It is computed against a measured temperature difference once you mark which sensor stands outdoors — Matter does not report that, and the readings alone cannot settle it.
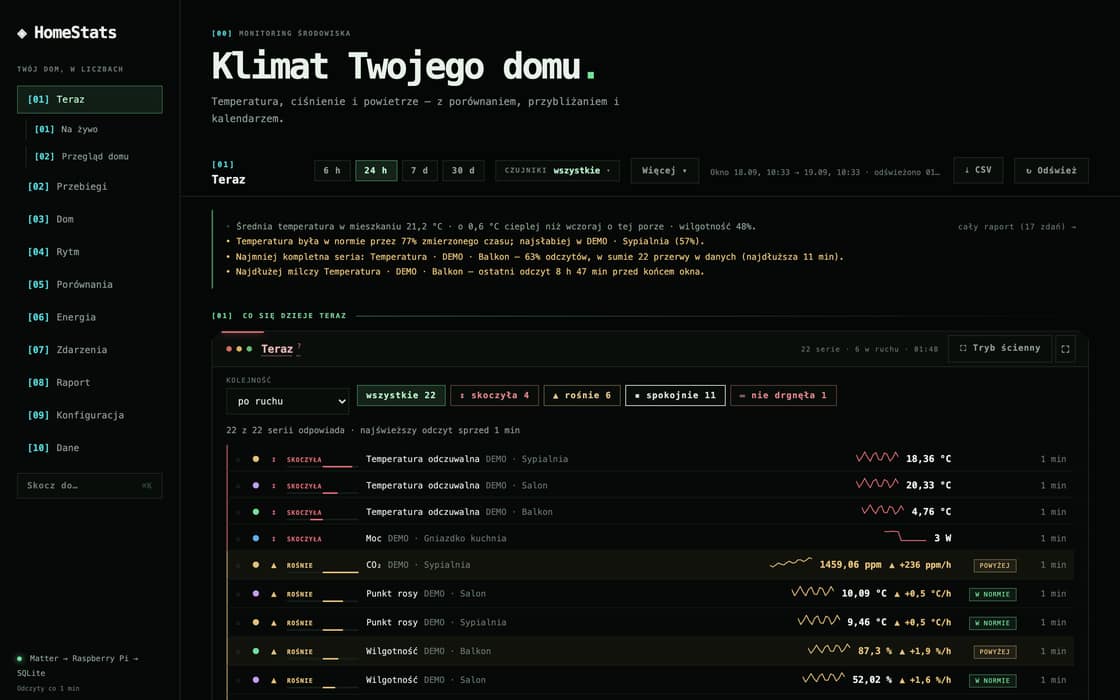
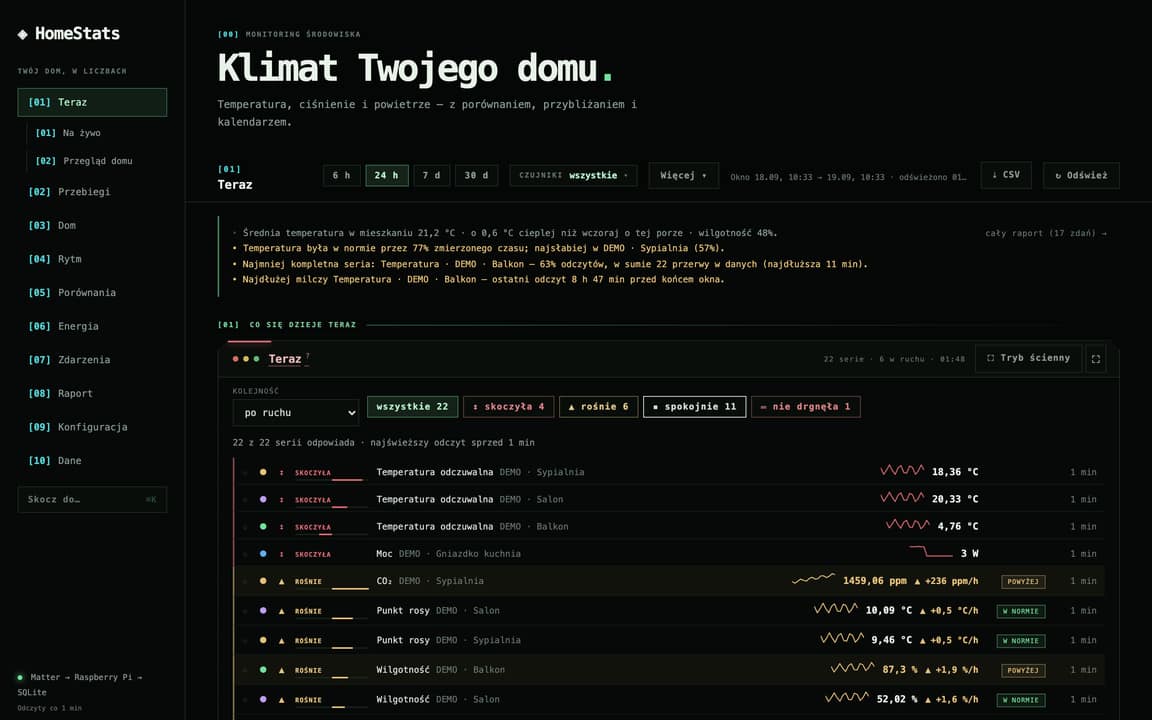
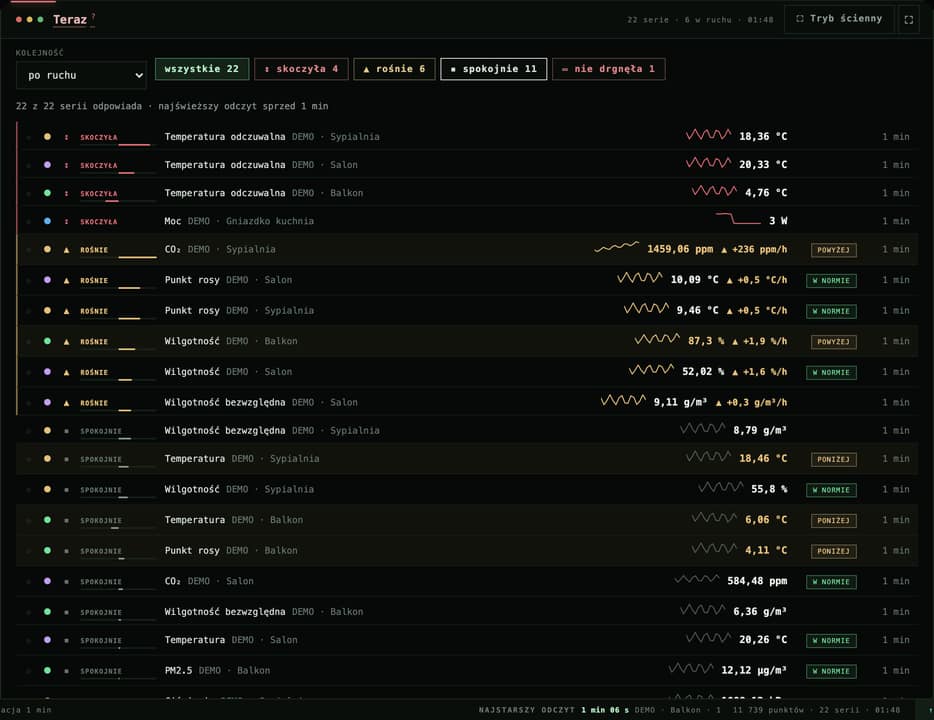
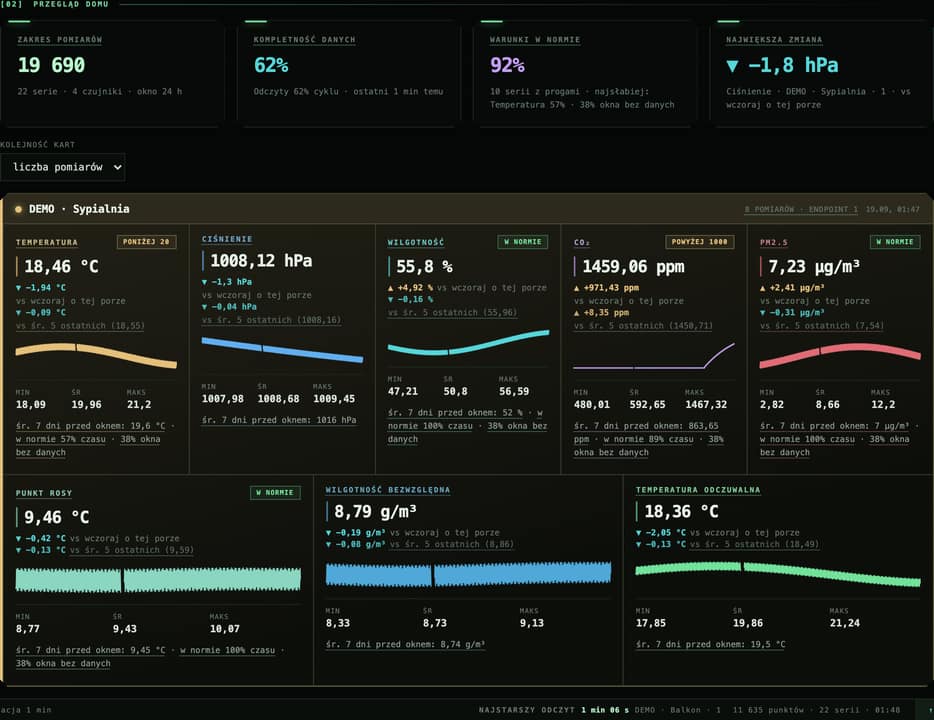
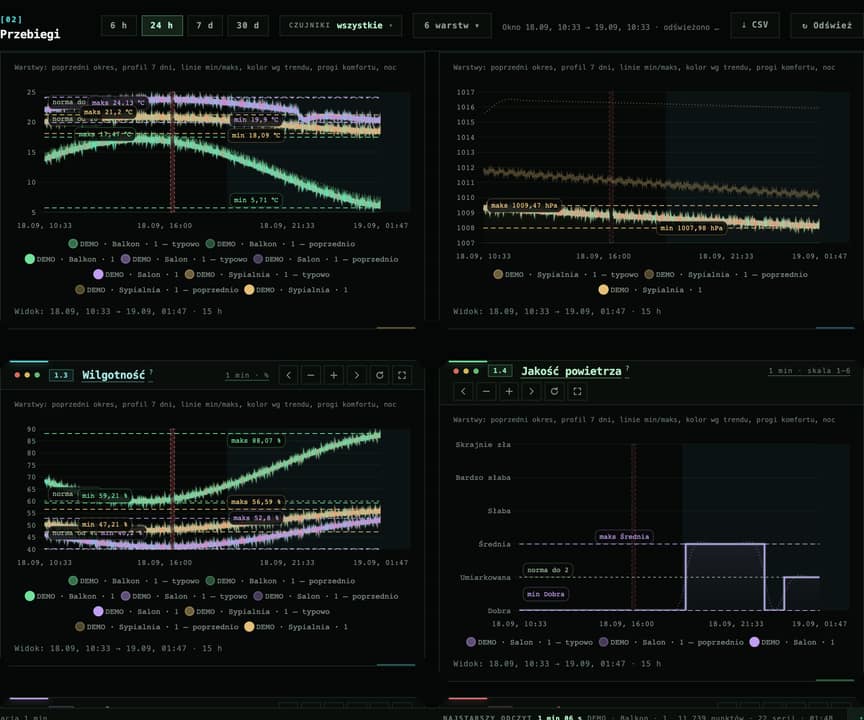
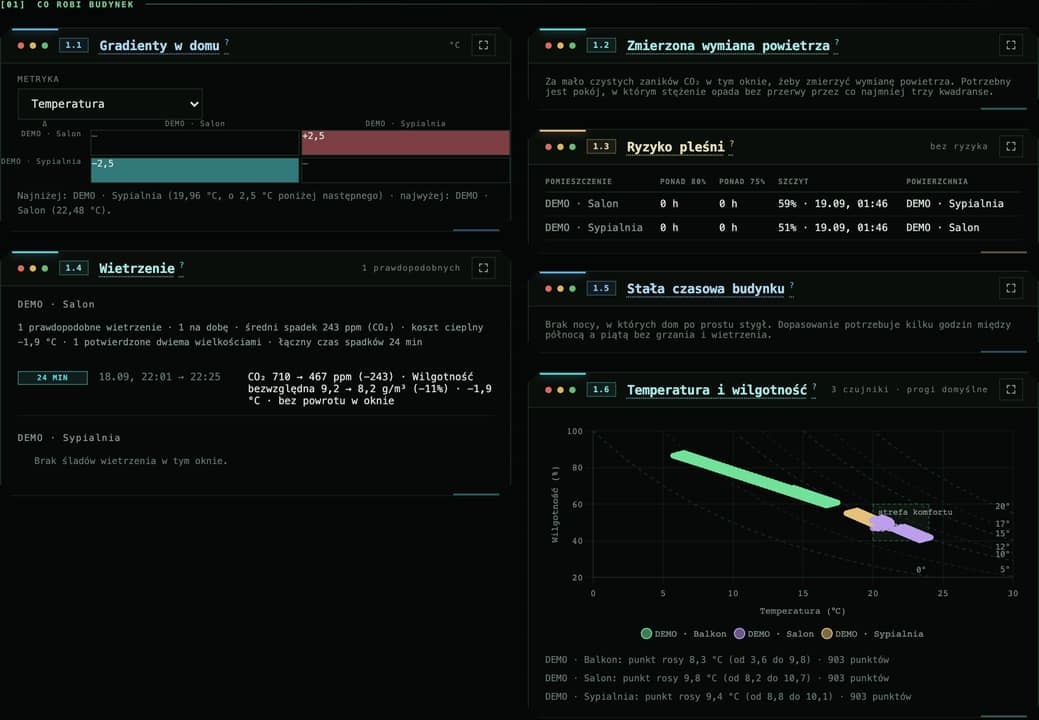
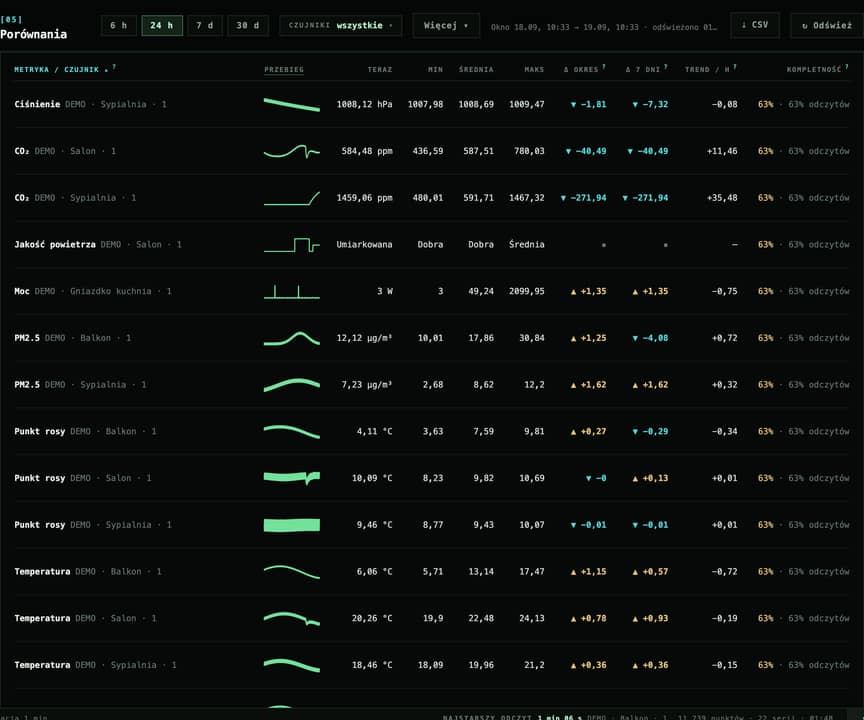
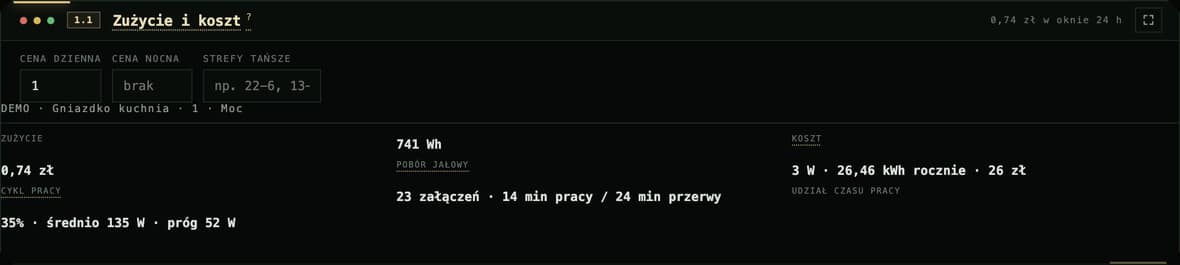
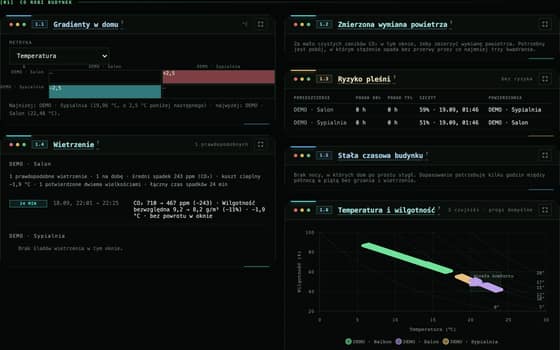
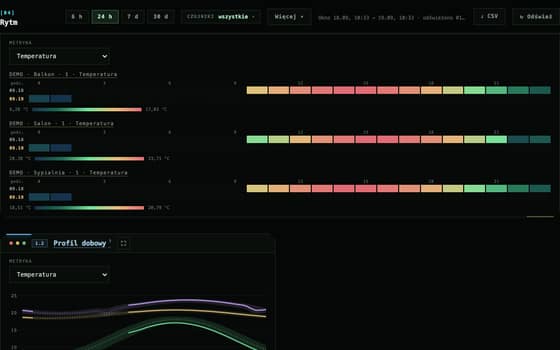
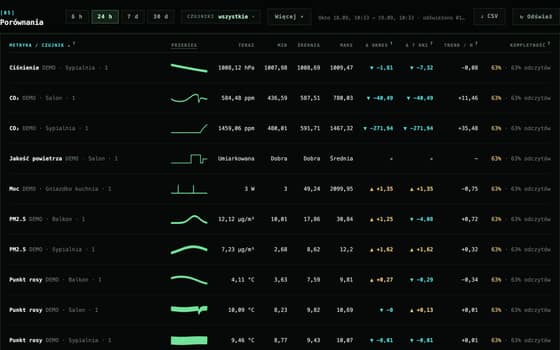
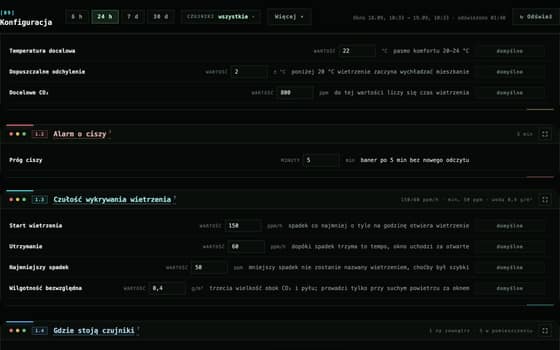
The screenshots come from a running server rather than a mockup. The demo database contains four devices, twenty-two series and enough history to show profiles, anomalies, seasons, energy cost and deliberate data gaps — without one reading from anybody’s home.
DASHBOARD · 24 H WINDOW
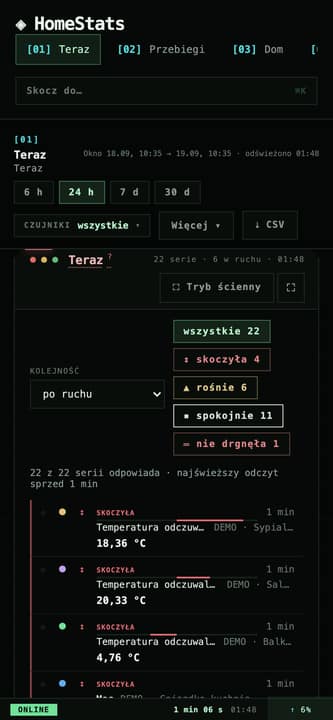
It all starts with the windowRange, calendar, layers and metrics sit in one bar above the whole page — a change here recomputes every panel below it. On the left, a list of charts that doubles as the table of contents.
+--[ DEMO ]--+The expanded gallery now crosses twelve frames: the opening view, live state, device cards, five analytical pages, events, rhythm, the calendar and two responsive layouts.
LIVE://WALL_MODE+--[ now ]--+15 MIN
// right_now
“In a moment” instead of “it was, at 3 a.m.”
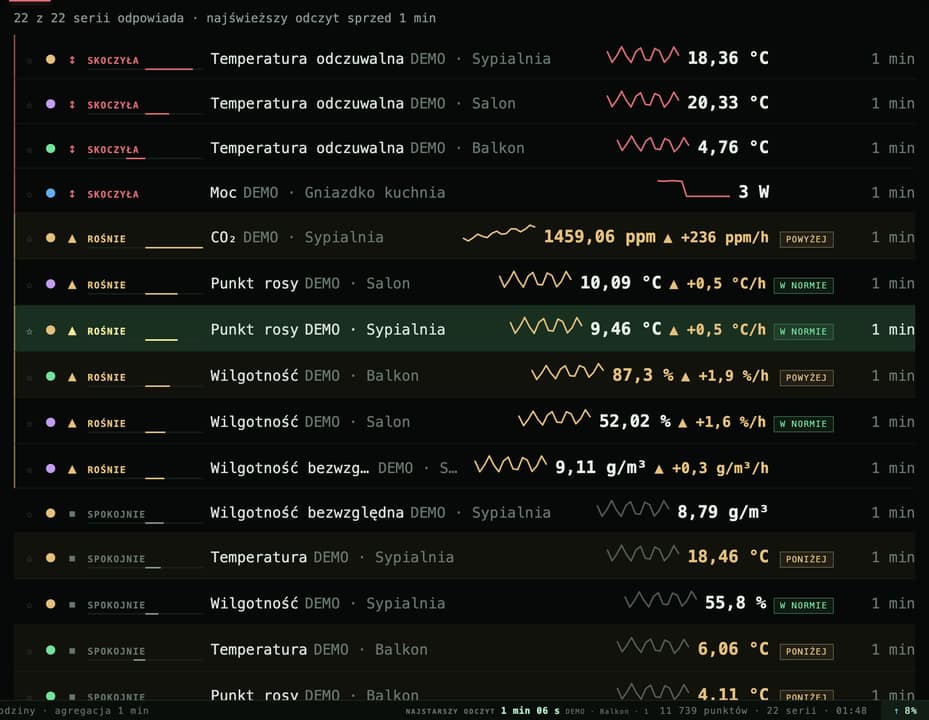
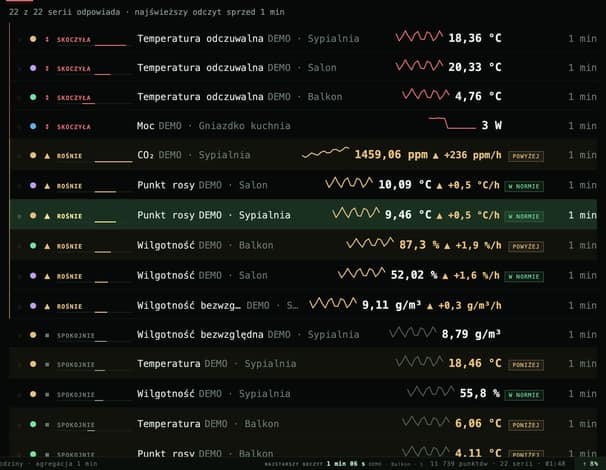
The dashboard describes a window, and the house is happening now — two different things, and the live section is for the second. Every series gets a sentence: what it reads, which way it is going, and how many minutes until it reaches the threshold at the current rate. A pulse says how many sensors are answering, and when they all go quiet at once it says plainly that this is the Raspberry Pi or the network, not the sensors.
[980 ppm] --+210/h--> [1000 ppm] ~6 min
15 min window for a series’ state2 h forecast horizon
A line says what happened in sequence. These panels ask about time over a limit, shared movement, mould, the bill, airing and the physics of humid air.
01DURATIONLOCAL
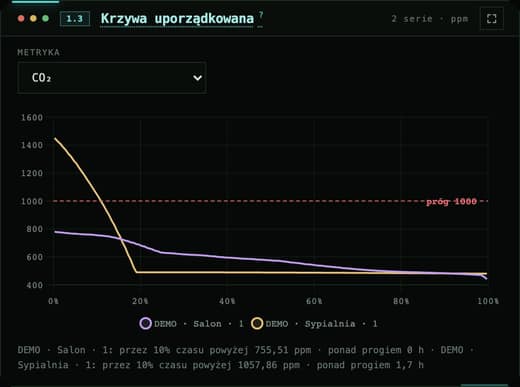
Duration curve
How much time a value spent above a line — not how often it appeared. Those are two different things, and only the first answers “how many hours was CO₂ over a thousand this month”.
02MATRIXLOCAL
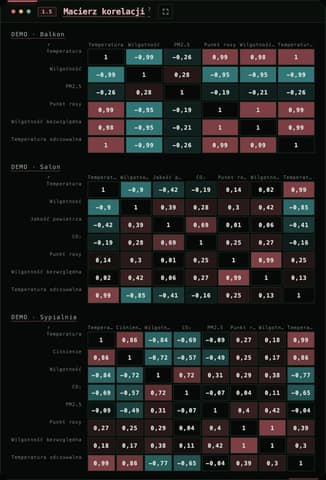
Correlation matrix
Every pair of measurements at once, sensor by sensor. This is where you see that bedroom humidity follows its temperature, and that the dust outside has little to do with either.
03MOULDLOCAL
Mould risk
Humidity computed at the coldest surface in the house rather than in the middle of the room: mould grows from 80% up, which is long before the water that condensation reports appears on the wall.
04ENERGYLOCAL
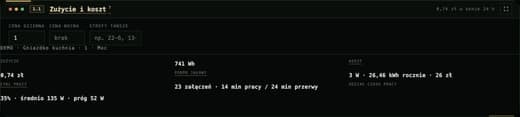
Consumption and cost
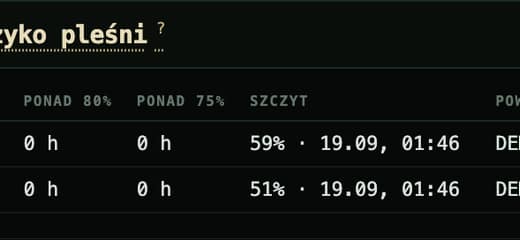
Kilowatt-hours, cost at your tariff, standby draw and the appliance’s duty cycle — with the bill split into what went on merely sitting in the socket and what went on working.
05AIRINGLOCAL
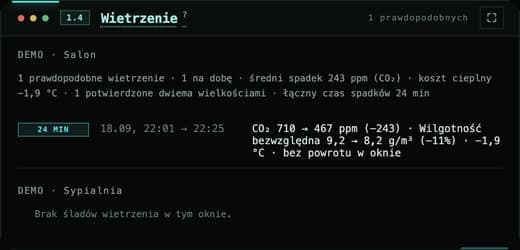
Airing without a contact sensor
A fast, sustained fall in CO₂ is marked as probable airing. The panel gives its duration, effectiveness and heat cost, while keeping the honest “probable”: a draught or everybody leaving can make the same trace.
06PSYCHROLOCAL
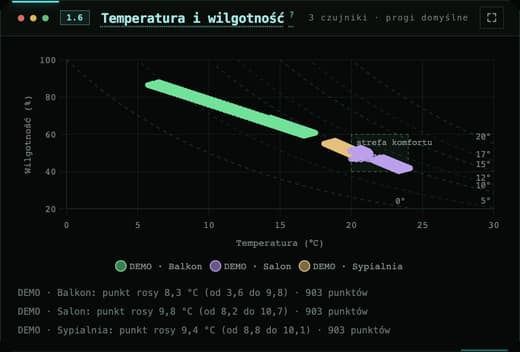
Temperature together with humidity
Measurements on a psychrometric plot, constant-dew-point lines and the comfort rectangle. It shows whether the air actually gained water or merely became colder.
+--[ MORE ]--+Beyond them: gradients between sensors, a measured air-change rate from CO₂ decay, day-by-day distributions, weekday box plots, an overlay of consecutive days, the rate at which the house warms up and the difference between two sensors over time.
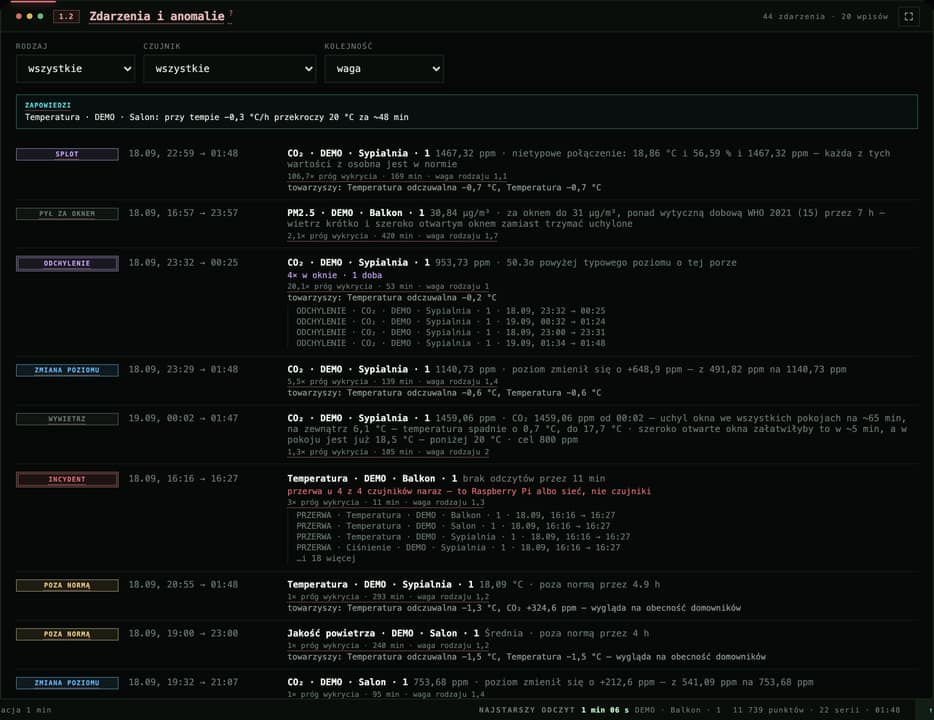
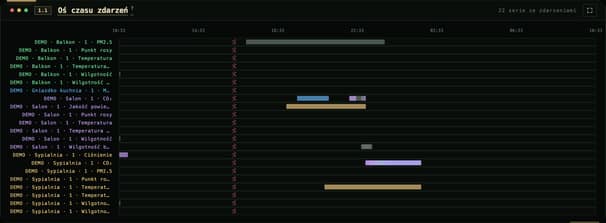
EVENTS://TIMELINE+--[ 22 series ]--+BY WEIGHT
// event_channel
Nineteen kinds of event from one set of readings.
Alongside deviation from the daily profile and a comfort threshold being crossed, there are: a lasting shift in level, calibration drift between two sensors, a combination of individually normal values, a weather front read from pressure, an open window inferred without a CO₂ sensor, and occupancy estimated from how fast CO₂ rises. Events from several sensors sharing a moment fold into an incident, and those still running at the edge of the window stand apart under “happening now”, with a minute counter instead of an end time.
[detect] --group--> [incident] --rank--> [weight]
19 kinds in the channel4 questions put to the socket
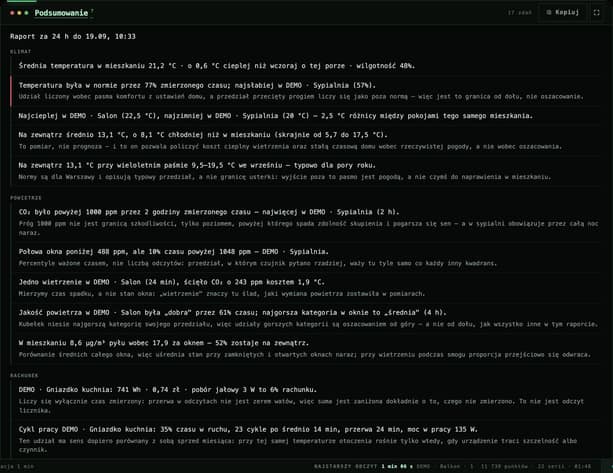
// report
The same numbers, arranged into sentences.
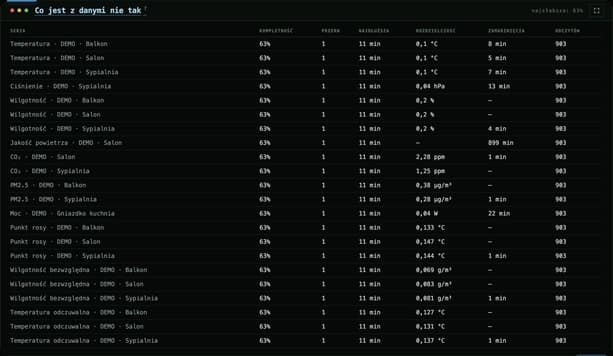
The report sums the window up in prose, under one rule with no exceptions: no sentence without a number. Beside it stands data quality — completeness, gaps, resolution and frozen values for every series in one table, worst first. Because that is what decides how much of the period being described was measured at all.
✓ the mean, and the comparison with yesterday at this hour
✓ hours above the threshold, not the number of crossings
✓ the weakest series and the longest gap in the data
✓ energy cost over the window, at your tariff
+--[ report://window ]--+
+--[ quality://series ]--+
// beside_the_dashboard
One application, six different questions.
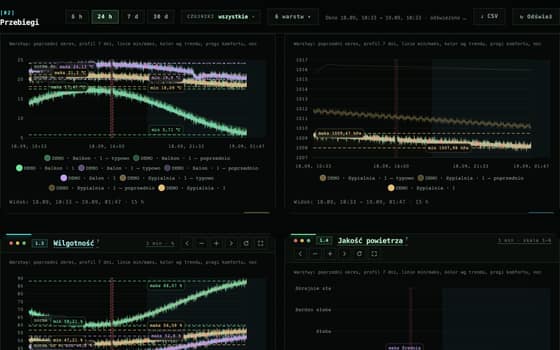
01/przebiegiSQLITE
Traces
Nine metrics on separate charts, with min–max bands, the previous period and a seven-day profile. Every chart can zoom and open full screen.
02/domSQLITE
House
Panels derived from building physics: gradients, air exchange, mould, airing, the thermal time constant and a joint view of temperature and humidity.
03/rytmSQLITE
Rhythm
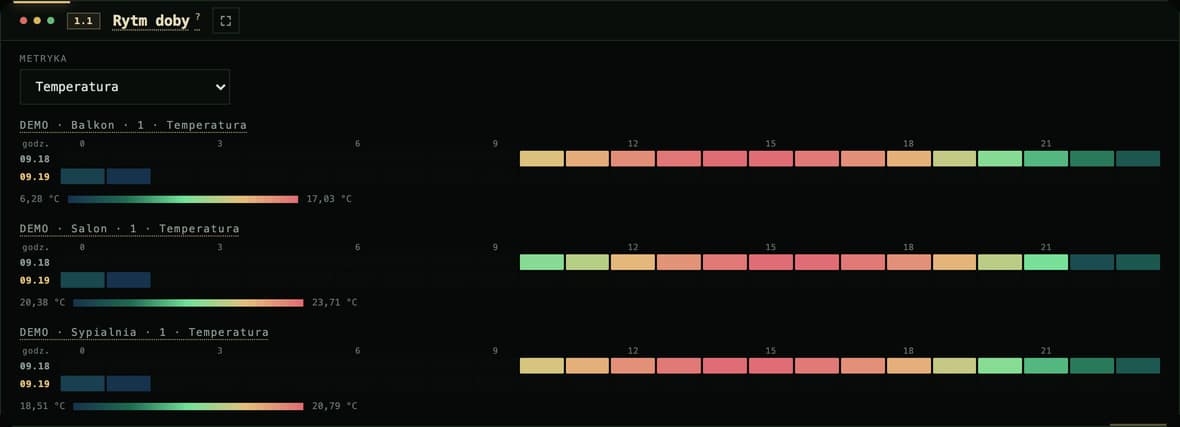
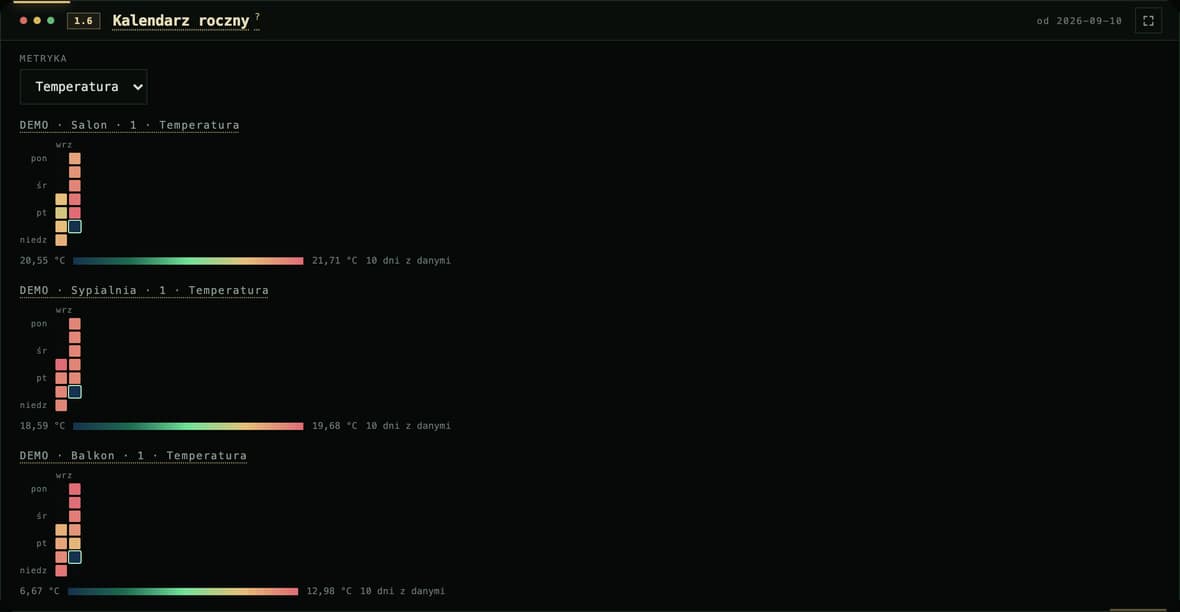
An hour map, daily profile, weekdays, period overlay, day-by-day distributions and a yearly calendar separate what repeats from what happened once.
04/porownaniaSQLITE
Comparisons
Seven panels from a table and histogram to correlation and the difference between two sensors. This is where hypotheses are tested, not merely where traces are viewed.
05/konfiguracjaSQLITE
Configuration
The flat’s climate, the silence-alarm threshold, where each sensor stands, per-sensor comfort thresholds and room volumes. All stored in the database on the Raspberry Pi, so the phone and the laptop read the same settings.
06/daneSQLITE
Data
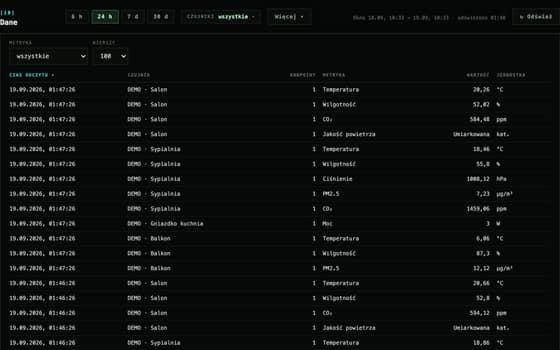
A table of raw readings straight from the database, with paging and sorting done by SQLite. Plus an export of the current window to CSV, one button in the bar above the dashboard.
+--[ OUTDOOR ]--+One setting changes five things at once: a sensor marked as outdoor stops being judged by room thresholds, drops out of the “conditions normal” tile, stops standing in for a surface that condensation could form on, and stops filling the event channel with the weather — and in return it brings the building’s time constant and the hint about when to open a window.
// privacy
A house that reports to nobody.
$ homestats --network-check
✓ accounts and signing in to a service 0
✓ readings sent to the cloud 0
✓ telemetry and analytics 0
✓ a subscription for your own data 0
status: everything stays on the Raspberry Pi
One file, one machine
Readings go to homestats.sqlite in the project directory. A backup is a copy of one file, and retention for raw readings and for the hourly aggregate is set separately — an hour weighs sixty times less than a minute, so the history can stay for years after the minutes are gone.
No login — and that is the boundary
Anyone who can see the server’s port on your network can see every reading. That is a deliberate decision for a flat, and equally the reason that port never gets exposed to the internet.
An installer that steps back
One script sets up the systemd units, builds the server and checks /api/health. If an update fails halfway it restores the services that were running before it started — the house is not left unmonitored because an install went wrong.
cloud = none;
>>>>>>> BUILD >>>>>>> TEST >>>>>>> SIGN >>>>>>> SHIP >>>>>>> BUILD >>>>>>> TEST >>>>>>> SIGN >>>>>>> SHIP >>>>>>> BUILD >>>>>>> TEST >>>>>>> SIGN >>>>>>> SHIP >>>>>>> BUILD >>>>>>> TEST >>>>>>> SIGN >>>>>>> SHIP [OK]--------[OK]--------[OK]--------[READY]-----[OK]--------[OK]--------[OK]--------[READY]-----[OK]--------[OK]--------[OK]--------[READY]-----[OK]--------[OK]--------[OK]--------[READY]-----return 0;....checksum:pass....mode:native....return 0;....checksum:pass....mode:native....return 0;....checksum:pass....mode:native....return 0;....checksum:pass....mode:native....
[ READY://LOCAL ]systemctl start
jakub@quanetra:~/projects/homestats$ status
The sensors measure anyway. The question is who reads it.